Power BI
Dashboard
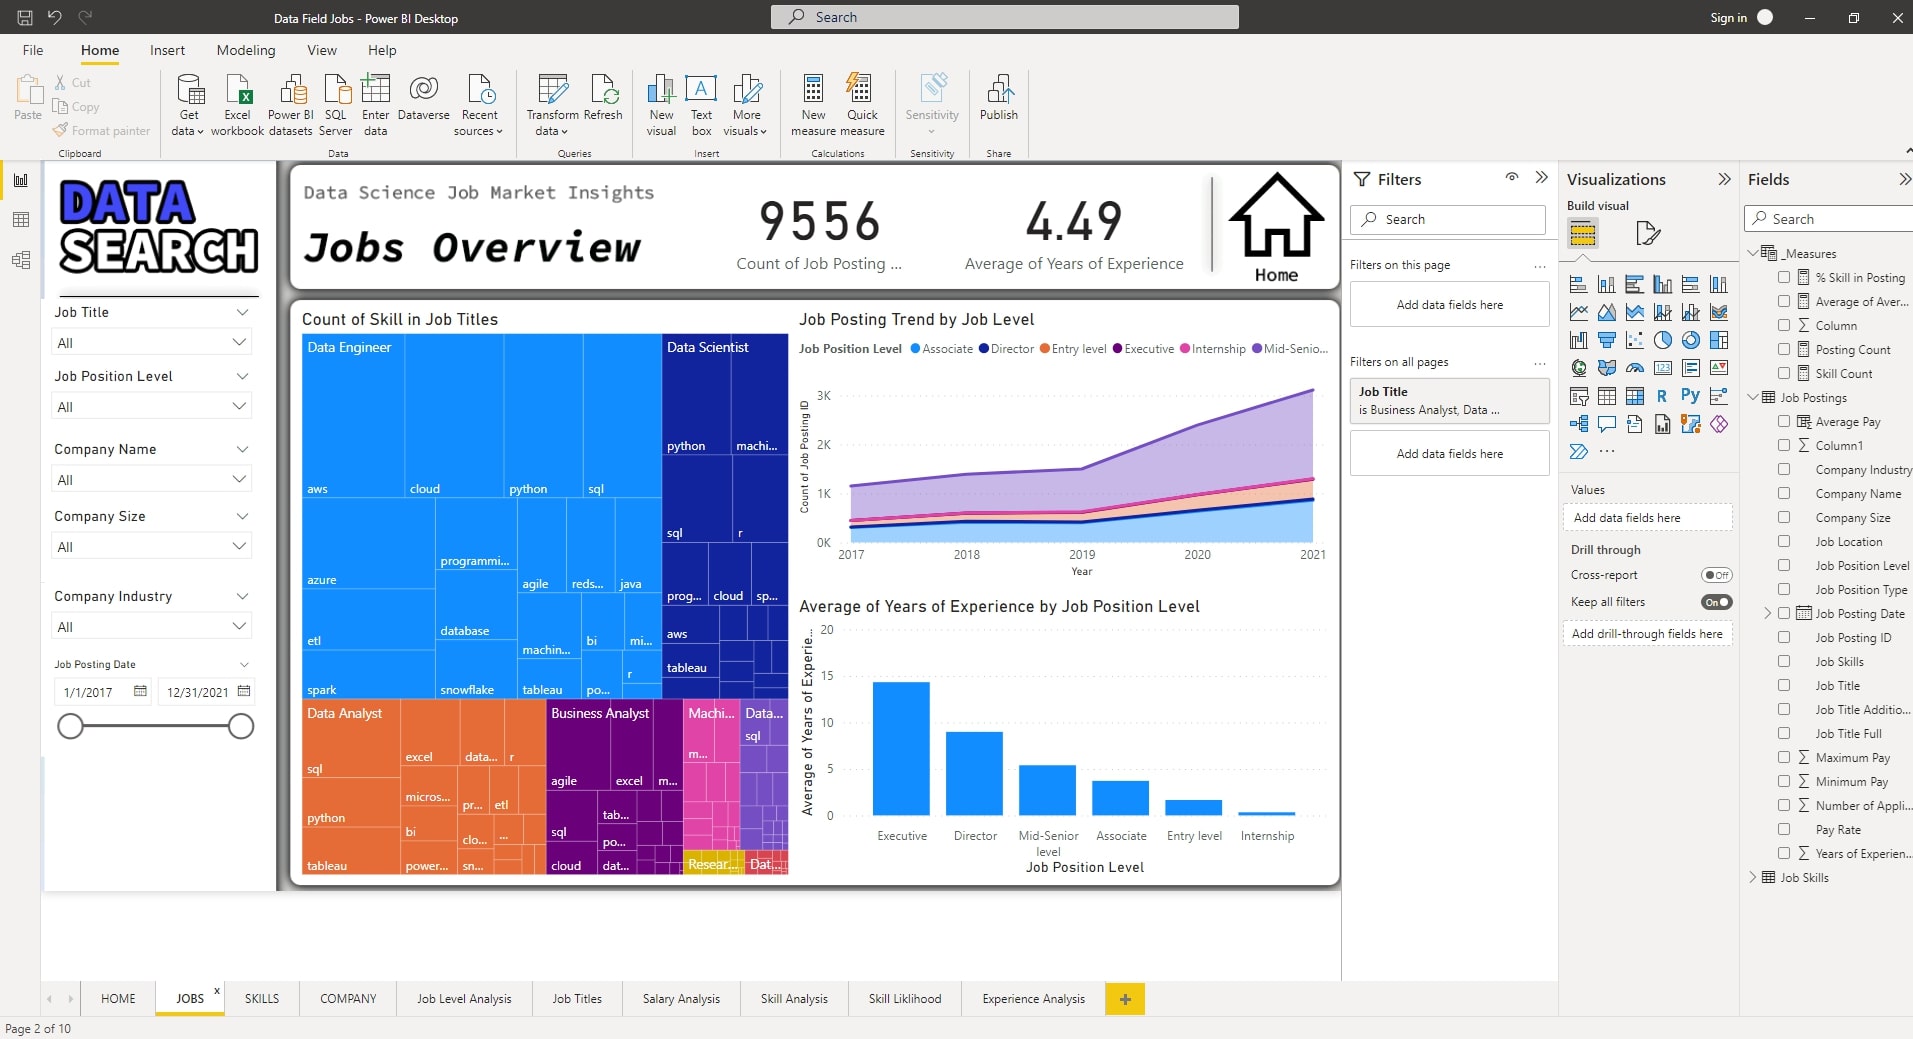
Data search is a recruiting firm that needs to uncover job trends in the data field. Below is an image showing part of the dashboard. Attached is a power point presentation report.
Who am I
David Mwangi is a proficient Data Analyst at Mosmarts Limited, a prominent software and data consultancy firm based in Nairobi, Kenya. His expertise lies in empowering businesses to make data-driven decisions that drive growth. He excels in communicating complex findings to non-technical stakeholders and collaborating with cross-functional teams to drive data initiatives. With a strong background in handling extensive financial and telecommunication datasets, David enjoys analyzing large datasets to identify trends, uncover patterns, and optimize operational processes. He takes pride in improving analytics efficiency by 30% through advanced automation techniques and streamlining report generation.
Python
Excel
Power BI
R
Sql
Tableau
Power Point
Data search is a recruiting firm that needs to uncover job trends in the data field. Below is an image showing part of the dashboard. Attached is a power point presentation report.

A global superstore has given us the task to identify what works best for them in terms of sales and profits. Using exploratory data analysis (EDA) we will help them identify the most and least profitable product categories. We also look into Segments, Geographical markets, and the performance trend over the years.

Bellabeat is a high-tech manufacturer of health-focused products for women. This is an analysis of smart device data to gain insight into how consumers are using the smart devices in R. The insights help guide the marketing strategy for the company.

An analysis of United Nations voting trends by member states on different topics of global importance through the years. R provides an incredible enviroment that allows us clean, transform, analyze and visualize the raw data for insights. Important libraries: dplyr, janitor, ggplot, broom, knitr etc.
We design the database schema and input and store Danny's customer data. We then query the database to answer questions about the pizza business. We use common table expressions, aggregate, window functions, case statements, temporary tables, etc to solve the business questions.

We use MS Excel to organize, manipulate, analyze and visualize netflix data. The visuals are built from the data aggregated in pivot tables.
.16604bf1.png)
Tableau is a powerful, intuitive and scalable platform that offers great business intelligence visuals.We can produce Worksheets, dashboards and storyboards from our data
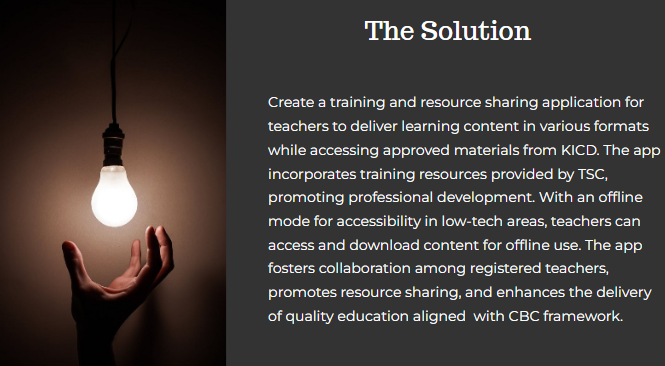
Pitching the CBC Arena app
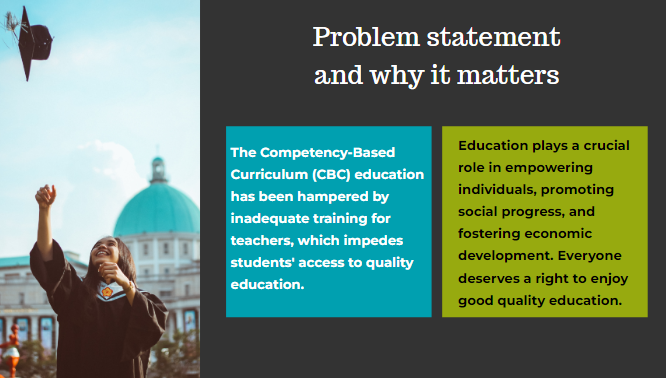
A Google Slides presentation of a team project to build the CBC Arena app that will help teachers get training on the fly on how to deliver the Competency Based Curriculum.
Contact Me